 PPVC tools
The PPVC approach draws on a package of empirically-grounded tools designed to answer key questions at different stages of the policy and investment process. These tools include four main components, namely Value chain mapping and gross margin analysis, Geo-spatial contextualization, Multi-market partial equilibrium (PE) modelling (BFAP multi-market model), and CGE economy wide modelling (IFPRI RIAPA model). The specific tools are detailed below.
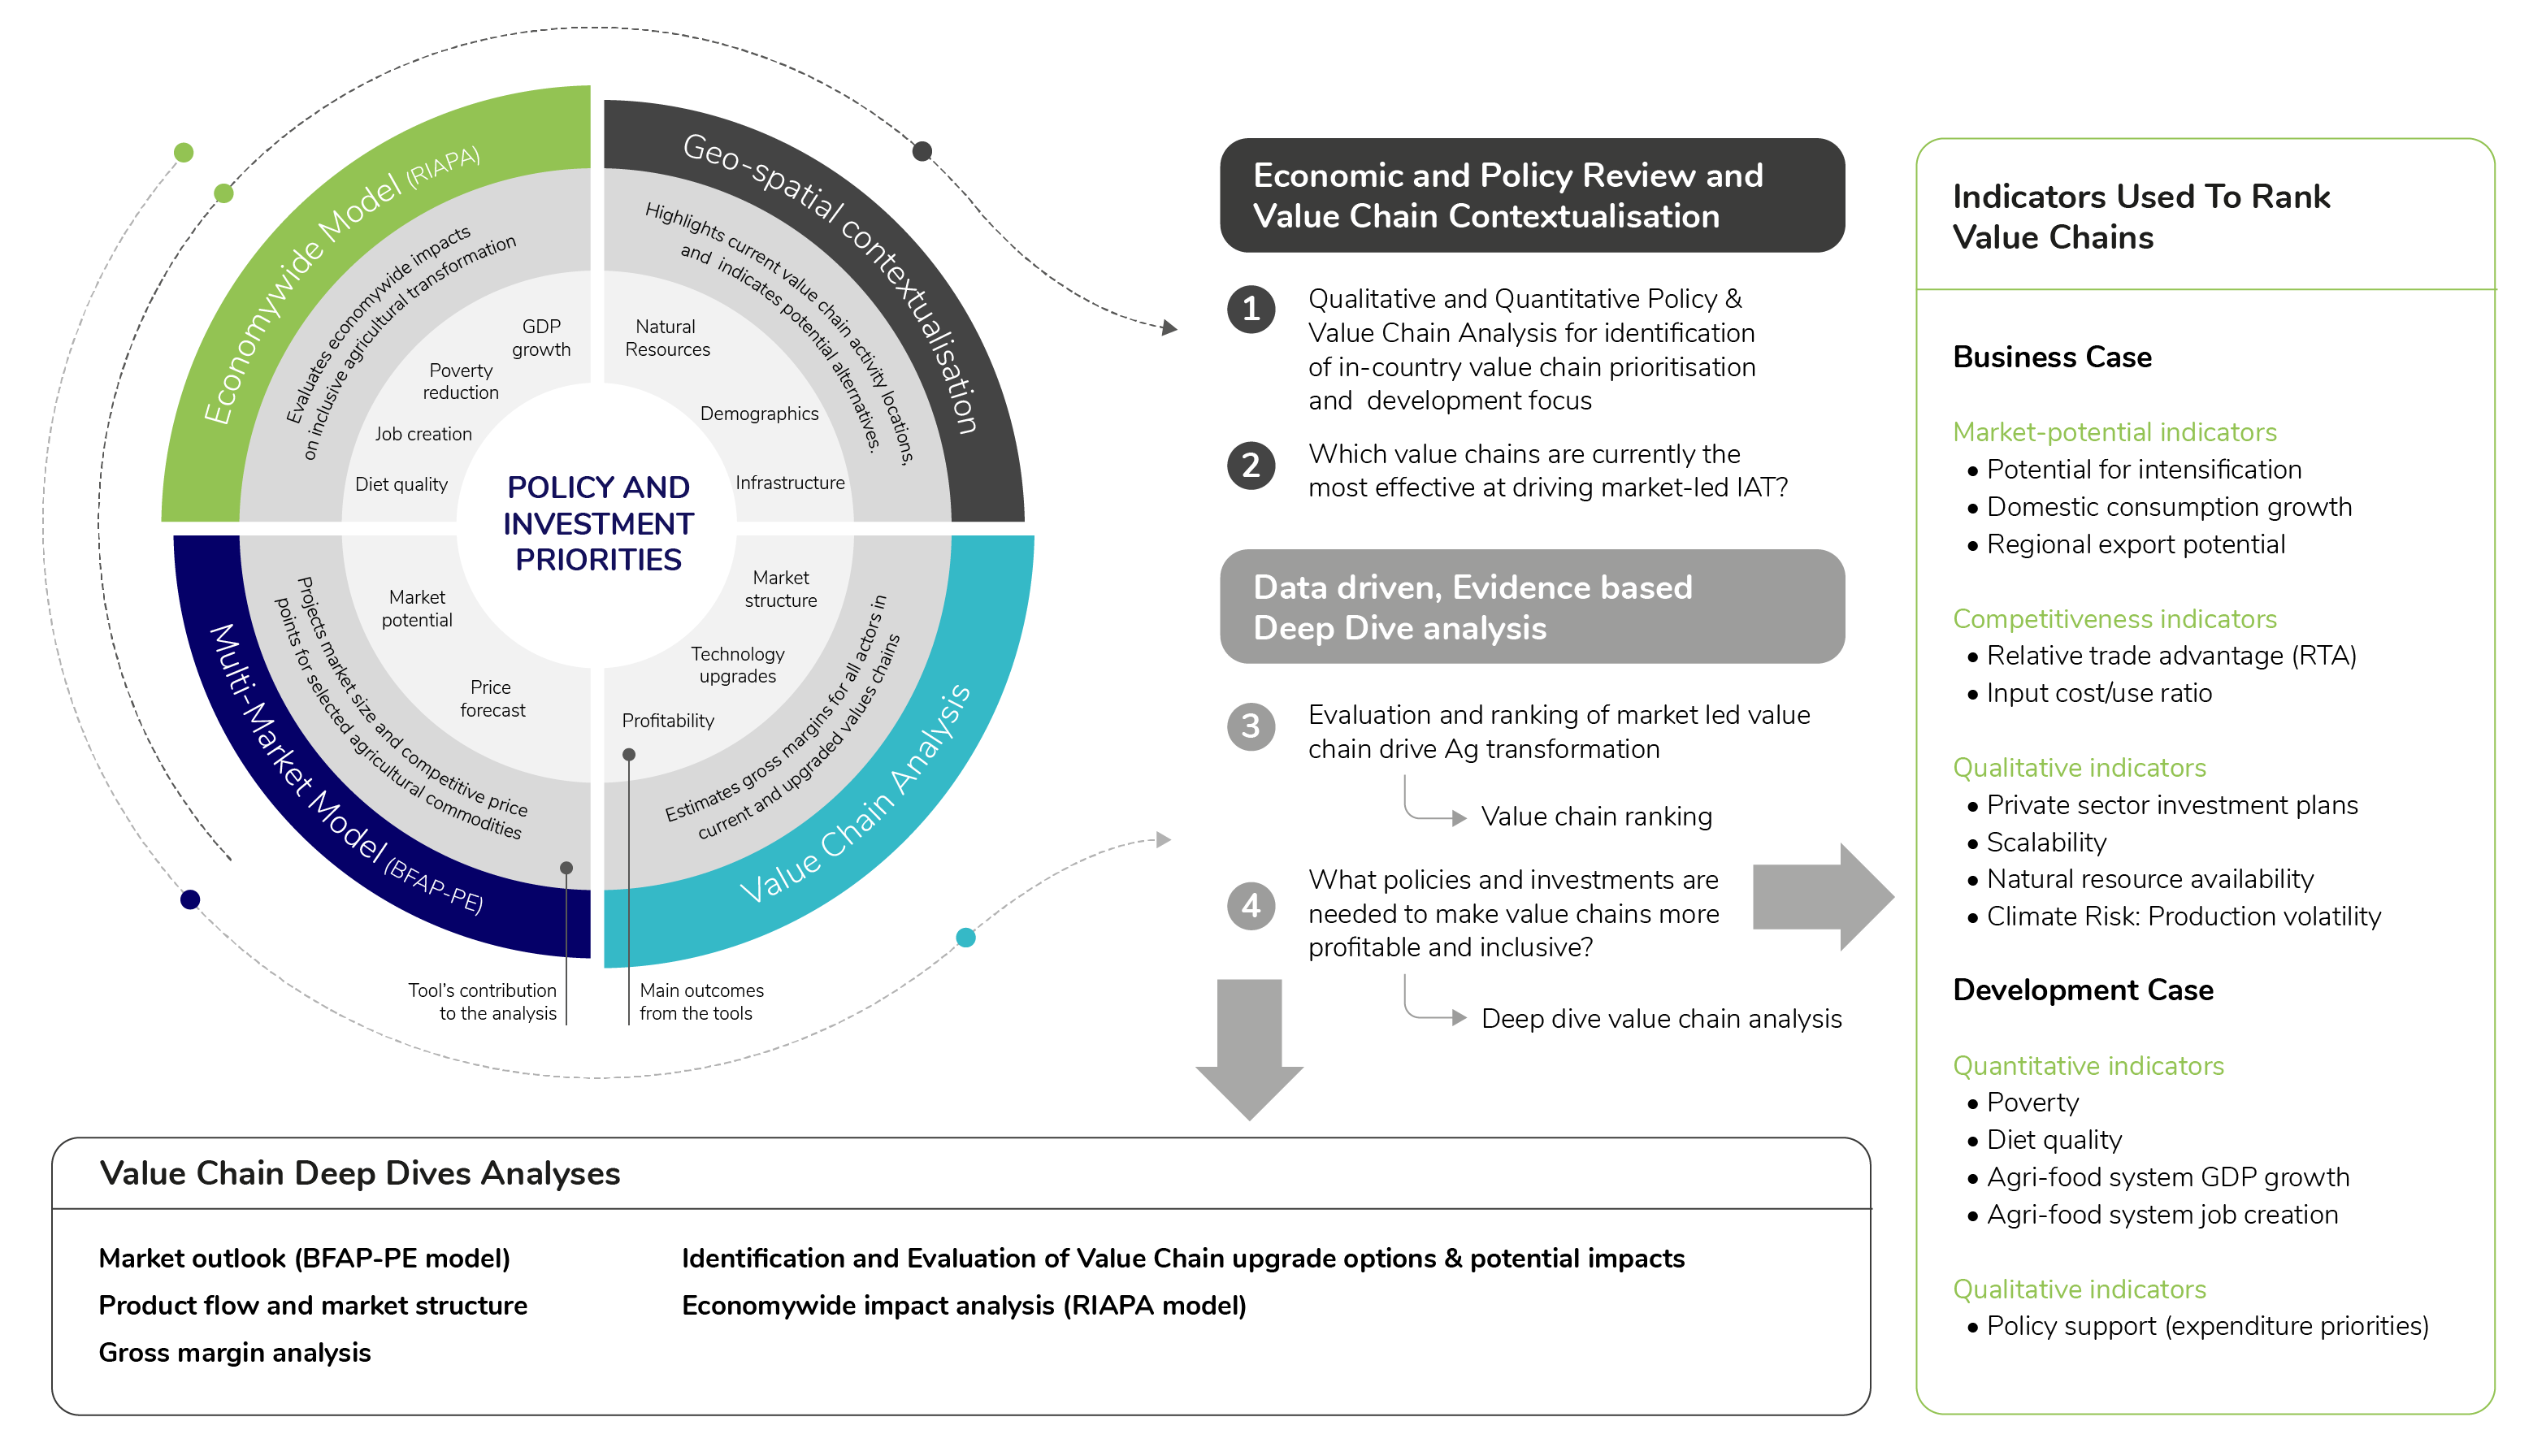
- PPVC tool 1: Geo-spatial contextualization highlights current value chain activity locations, and also indicates potential alternatives based on infrastructure, natural resources, demographics, etc.
- PPVC tool 2: Value chain mapping and gross margin analysis identifies key actors and product flows, and estimates gross margins at various points of the chain to inform investment needs and feasibility.
- PPVC tool 3: Multi-market partial equilibrium (PE) modelling is used to assess impacts on agricultural production, prices, trade flows, and consumption (including agro-processing) under alternative future states with respect to specific interventions and investments.
- PPVC tool 4: CGE economywide modelling Economywide model evaluates broader economic and socioeconomic impacts of value chain, policy and public investment choices on inclusive agricultural transformation (poverty reductions, agri-food system growth and employment, diets, and other outcomes).
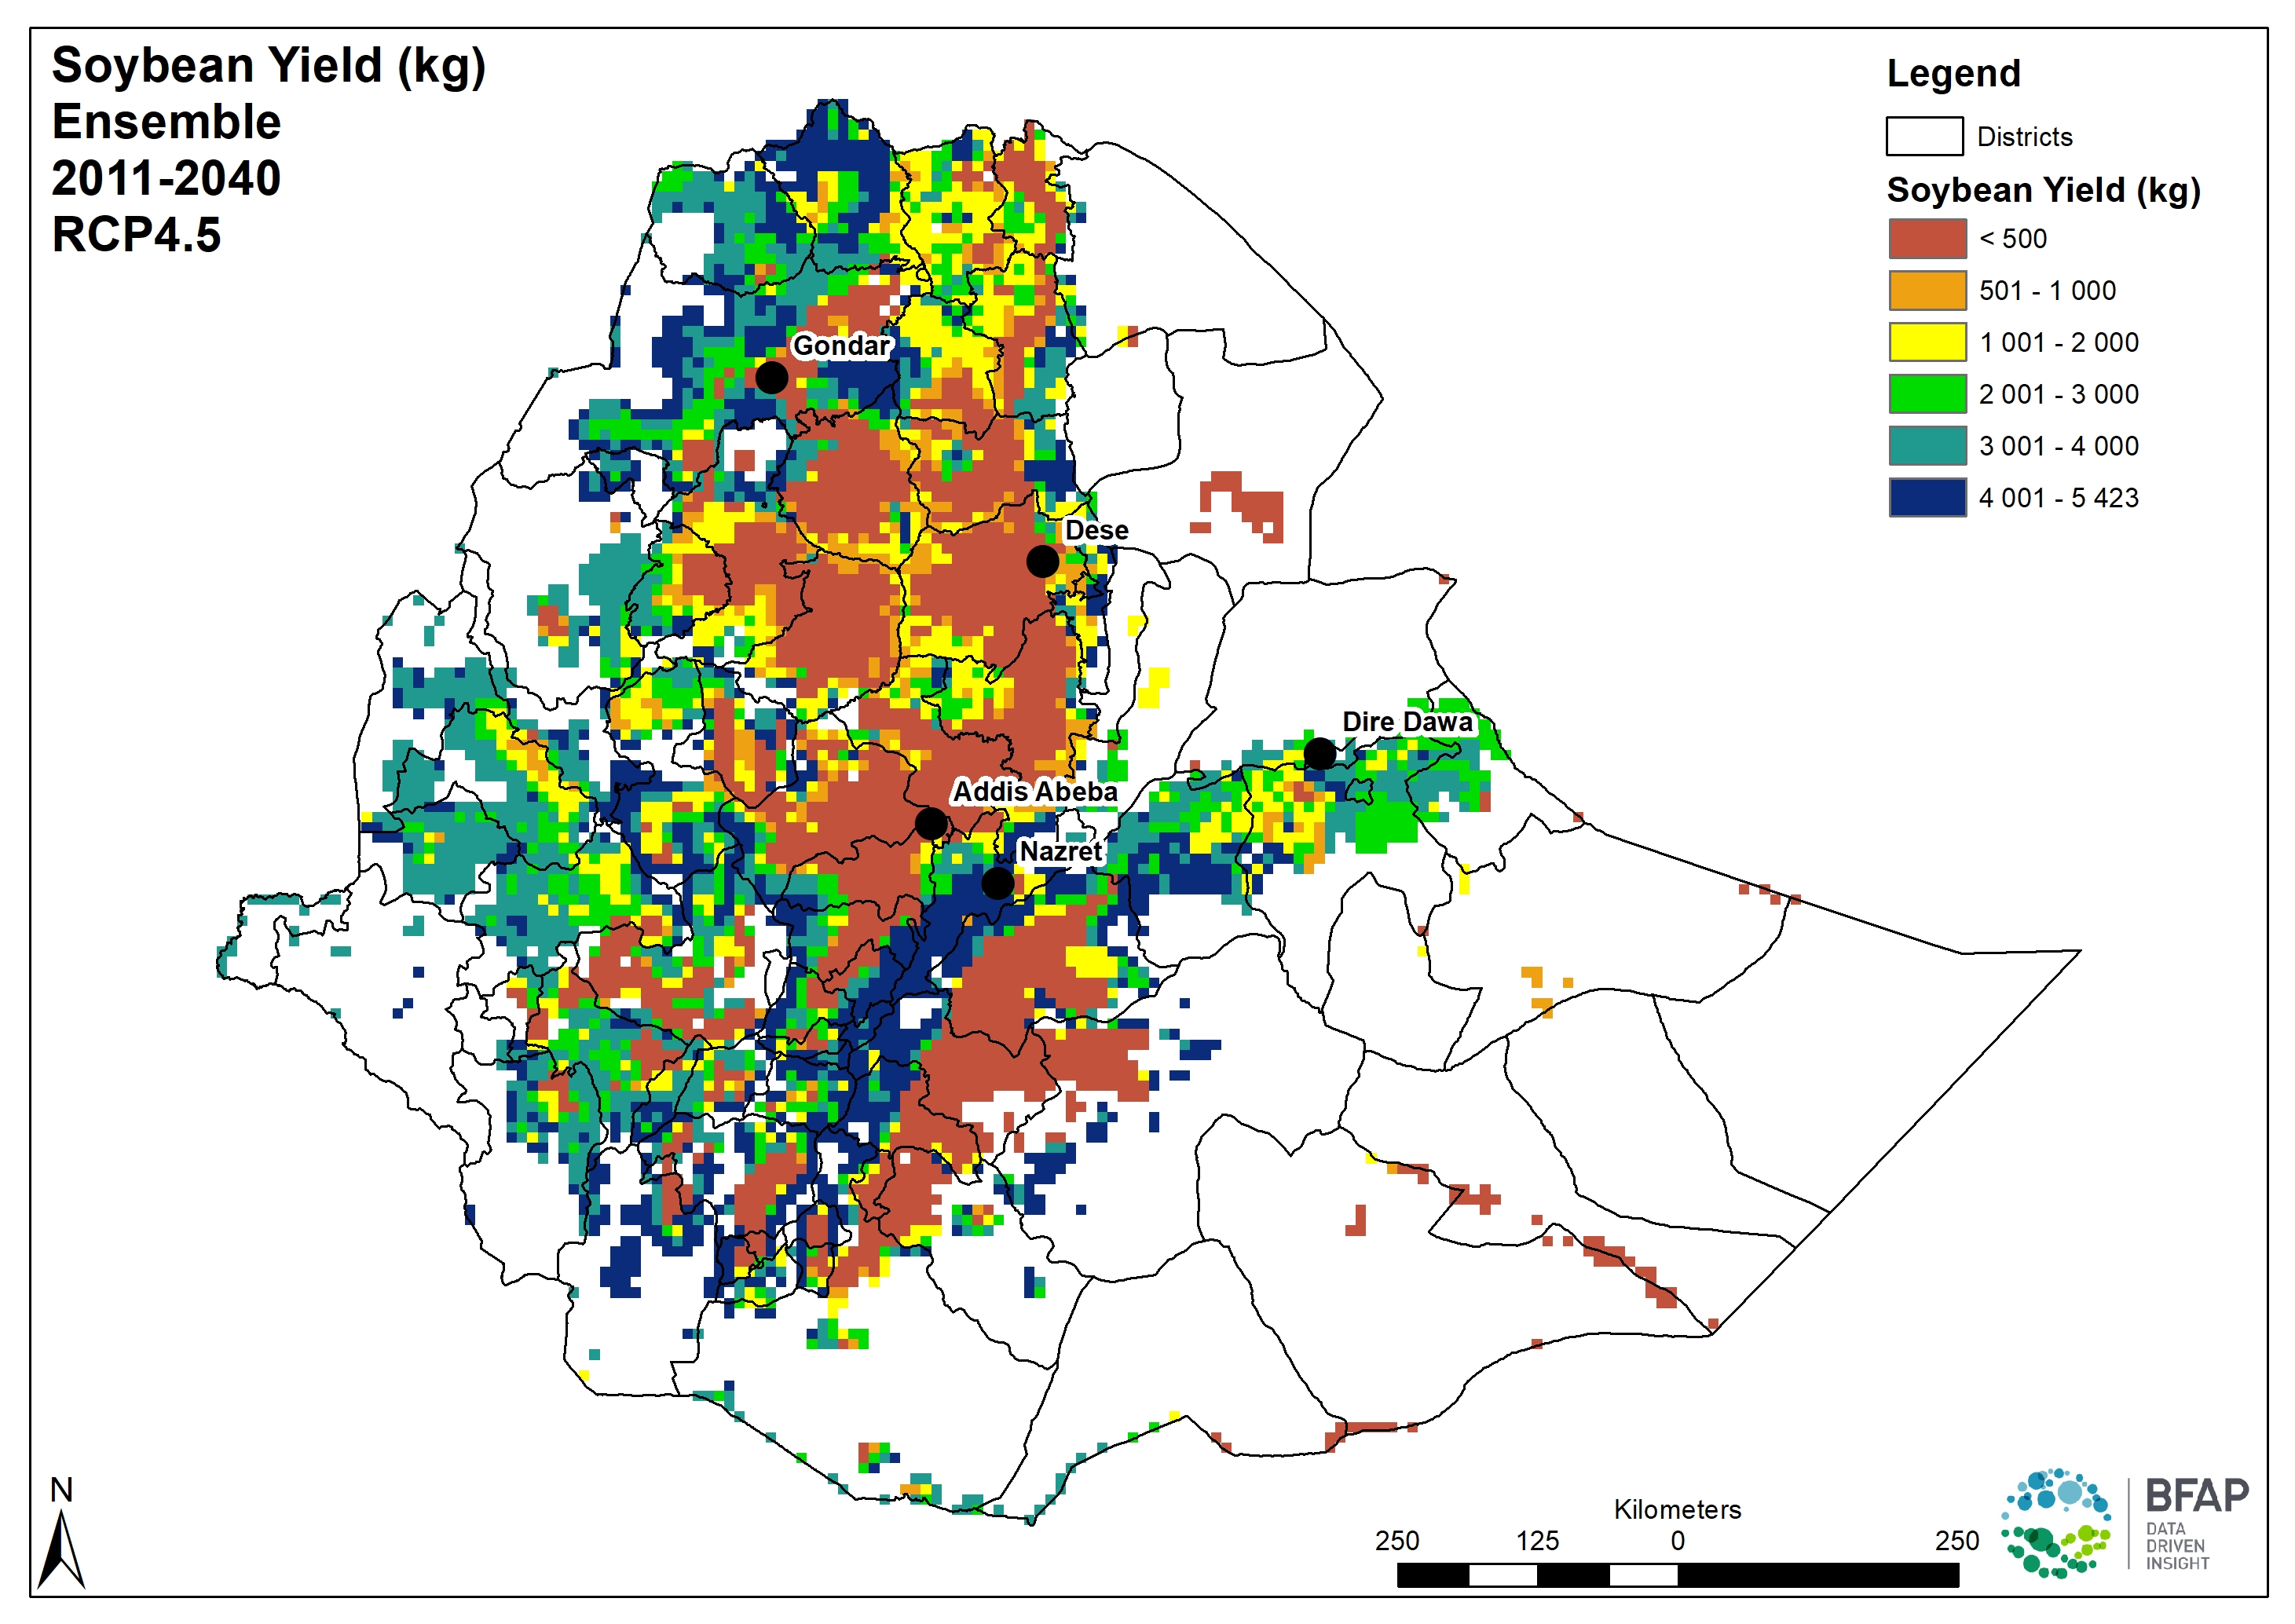
PPVC tool 1: Geospatial contextualization
GIS software is utilized to provide a geospatial perspective to the value chain selection and deep dive steps in the PPVC Approach. Climate, natural resource (land, water and soil), infrastructure, demographics and agricultural resource datasets are collated and processed for each country to provide comprehensive context to the value chain ranking and selection process. Further value chain specific spatial analysis is performed during the deep dive steps for example:
- Quantification of potential available crop land
- Quantification of current agricultural resources (livestock or crop specific)
- Quantification of climate change impact (e.g. spatial analysis of yield impacts given future climate scenarios)
The analyses are dependent on data availability and may require some permutations, given the value chain specific research questions.

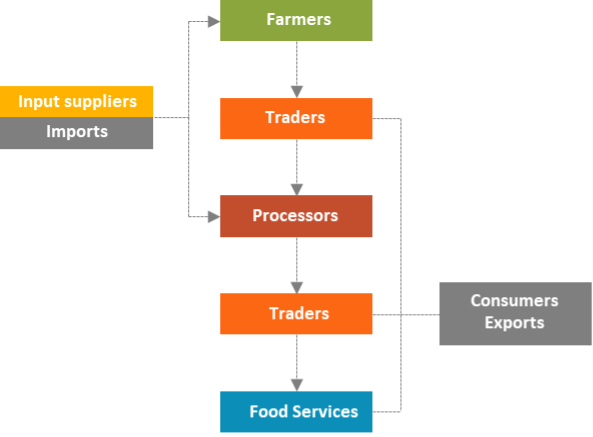
PPVC tool 2: Value chain mapping and gross margin analysis
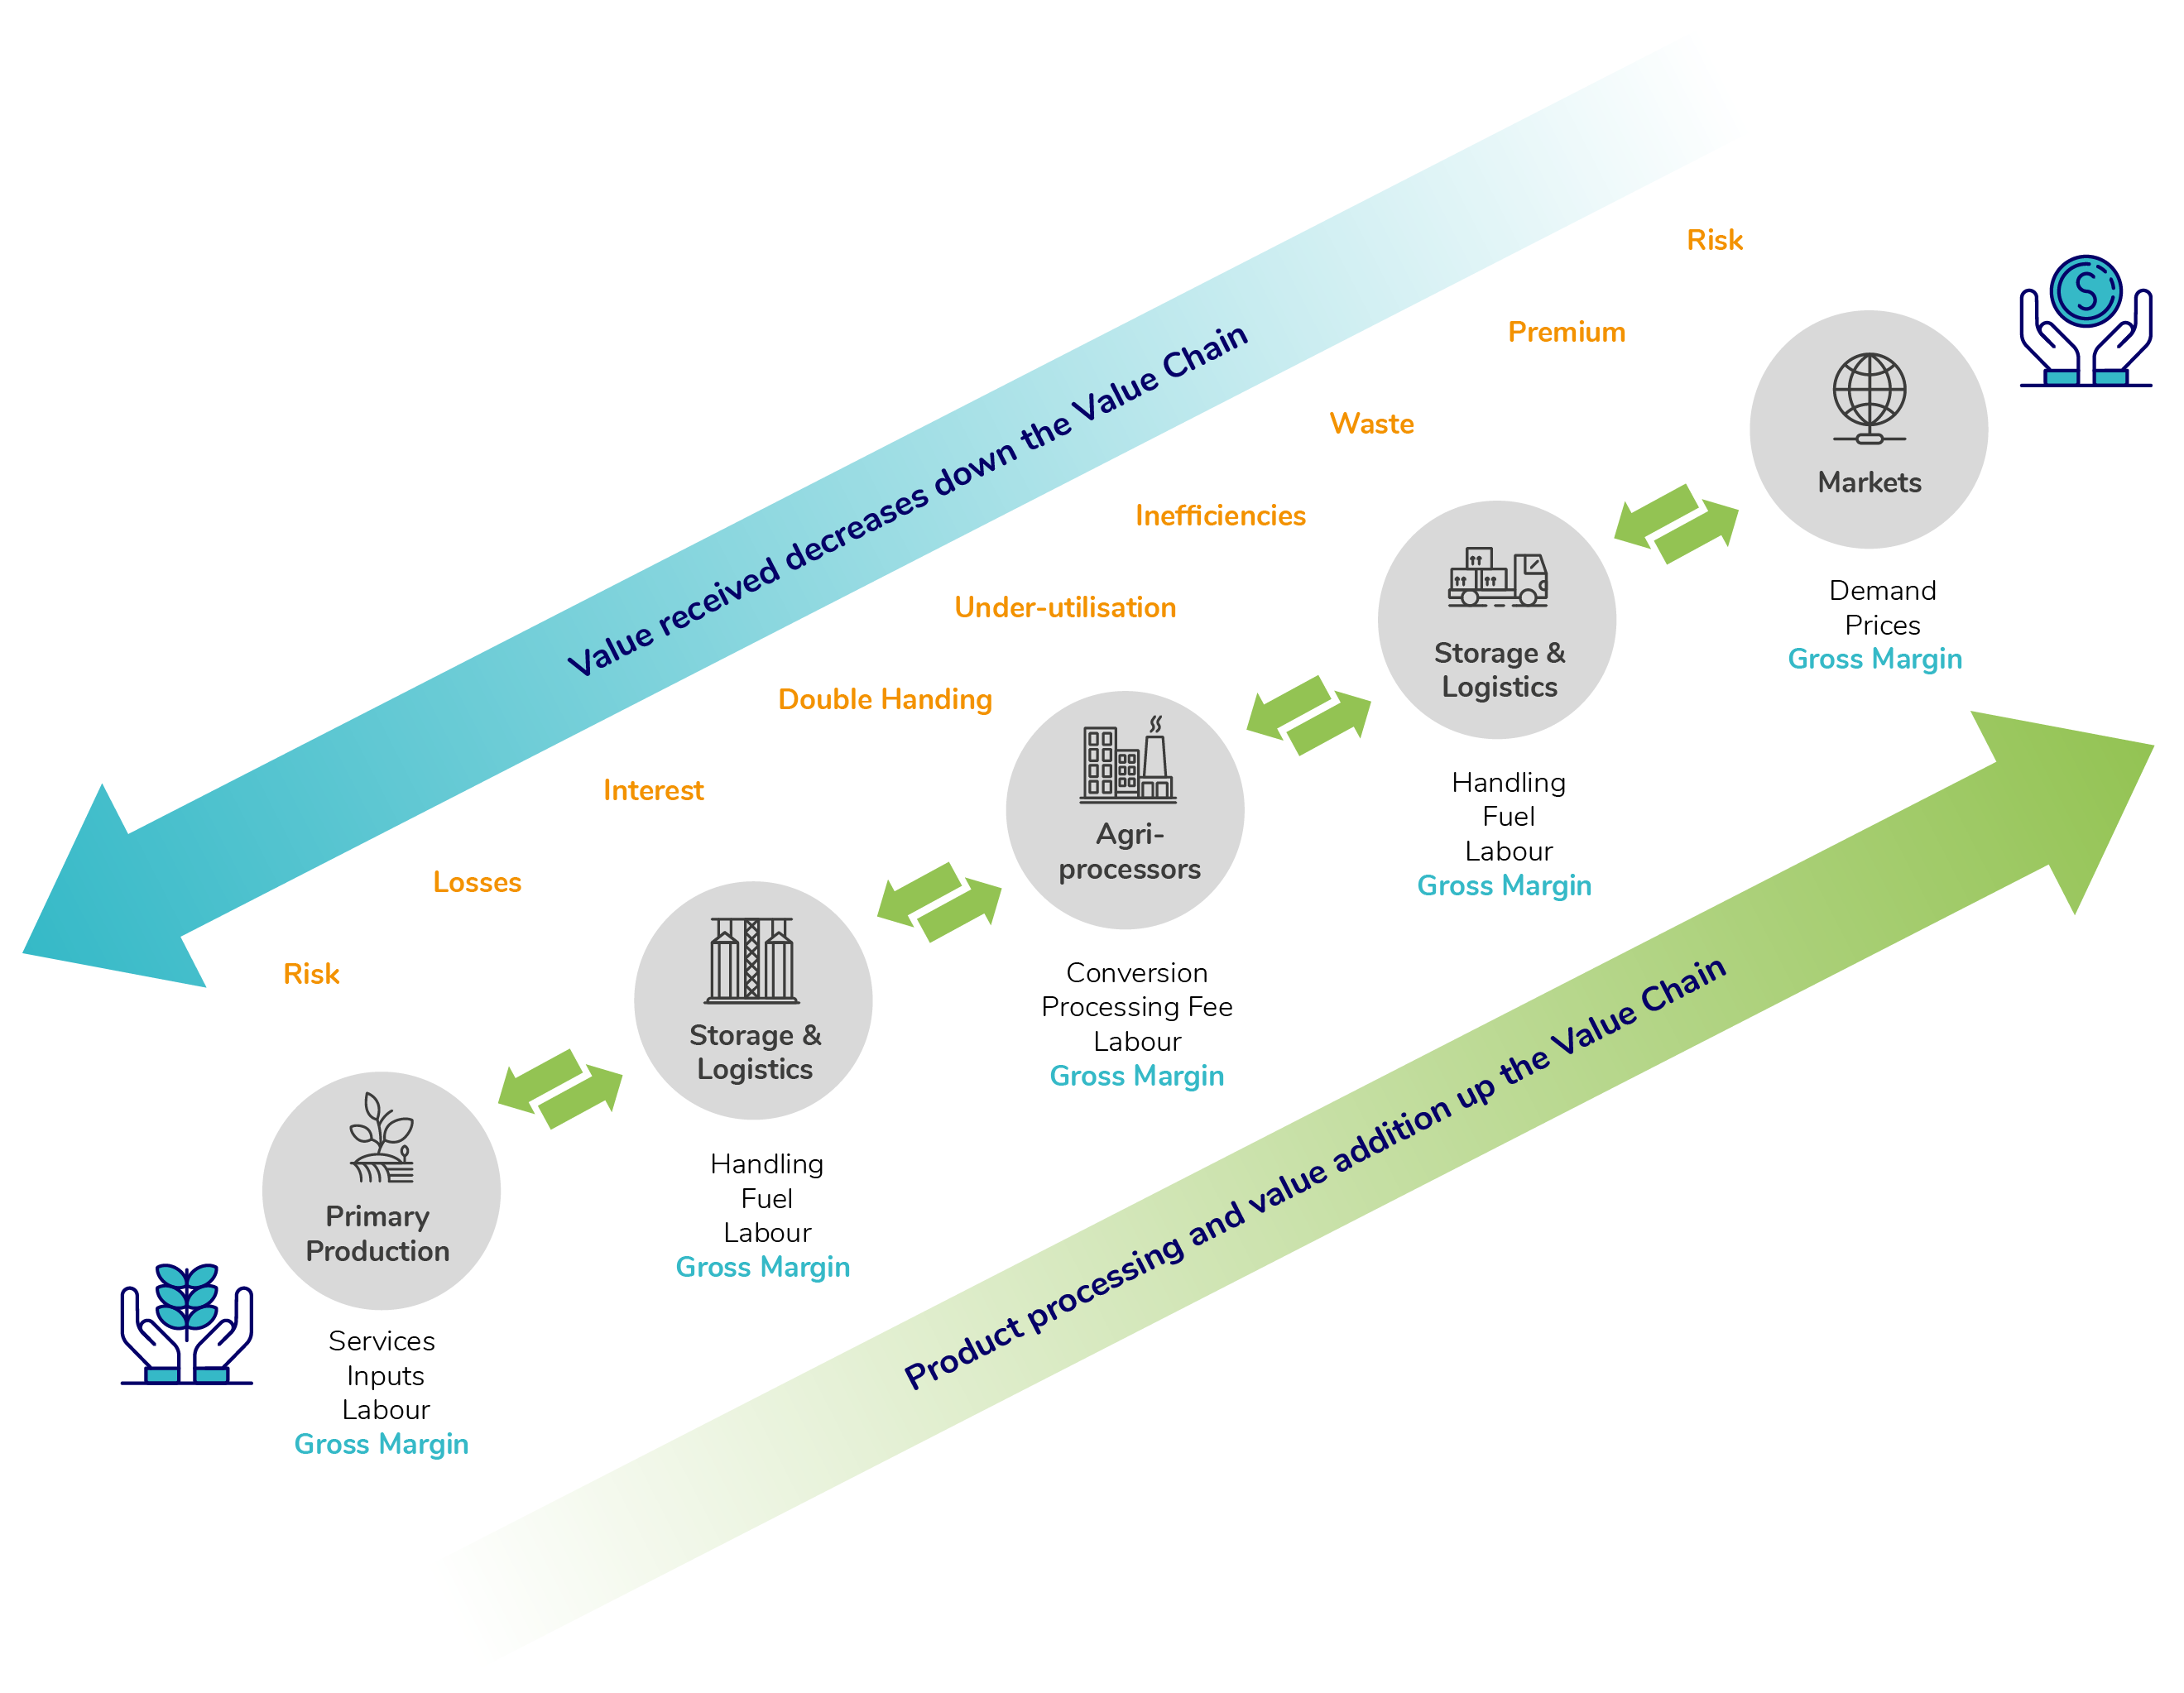
Value chain analytics follows a holistic market-led approach which combines classic value chain frameworks with empirical models that are anchored in pragmatic ground-truthing. The linking of product flows, value chain mapping and margins at farm, storage & logistics, agri-processing and market nodes of the value chain into sector and economy-wide models enables the evaluation of various scenarios, value chain upgrades and optimization outcomes. This framework generates granular insights which guide actionable policy and investment decisions.
-
Cost Benefit Analysis
Evaluating the cost-benefit of policies and investments, within value chains, across sectors and in the broader economy -
Monitoring and Evaluation (M&E)
Tracking KPIs through ex-post and ex-ante policies and investment interventions against set targets -
Spatial Targeting
Assessing the socio-economic viability and profitability of value chain upgrades through private and public sector interventions -
Mapping
Profiling value chain actors and linkages, institutions (i.e. rules, regulations, policies etc.), product flow and margins
PPVC tool 3: BFAP's Africa multi market partial equilibrium (PE) model
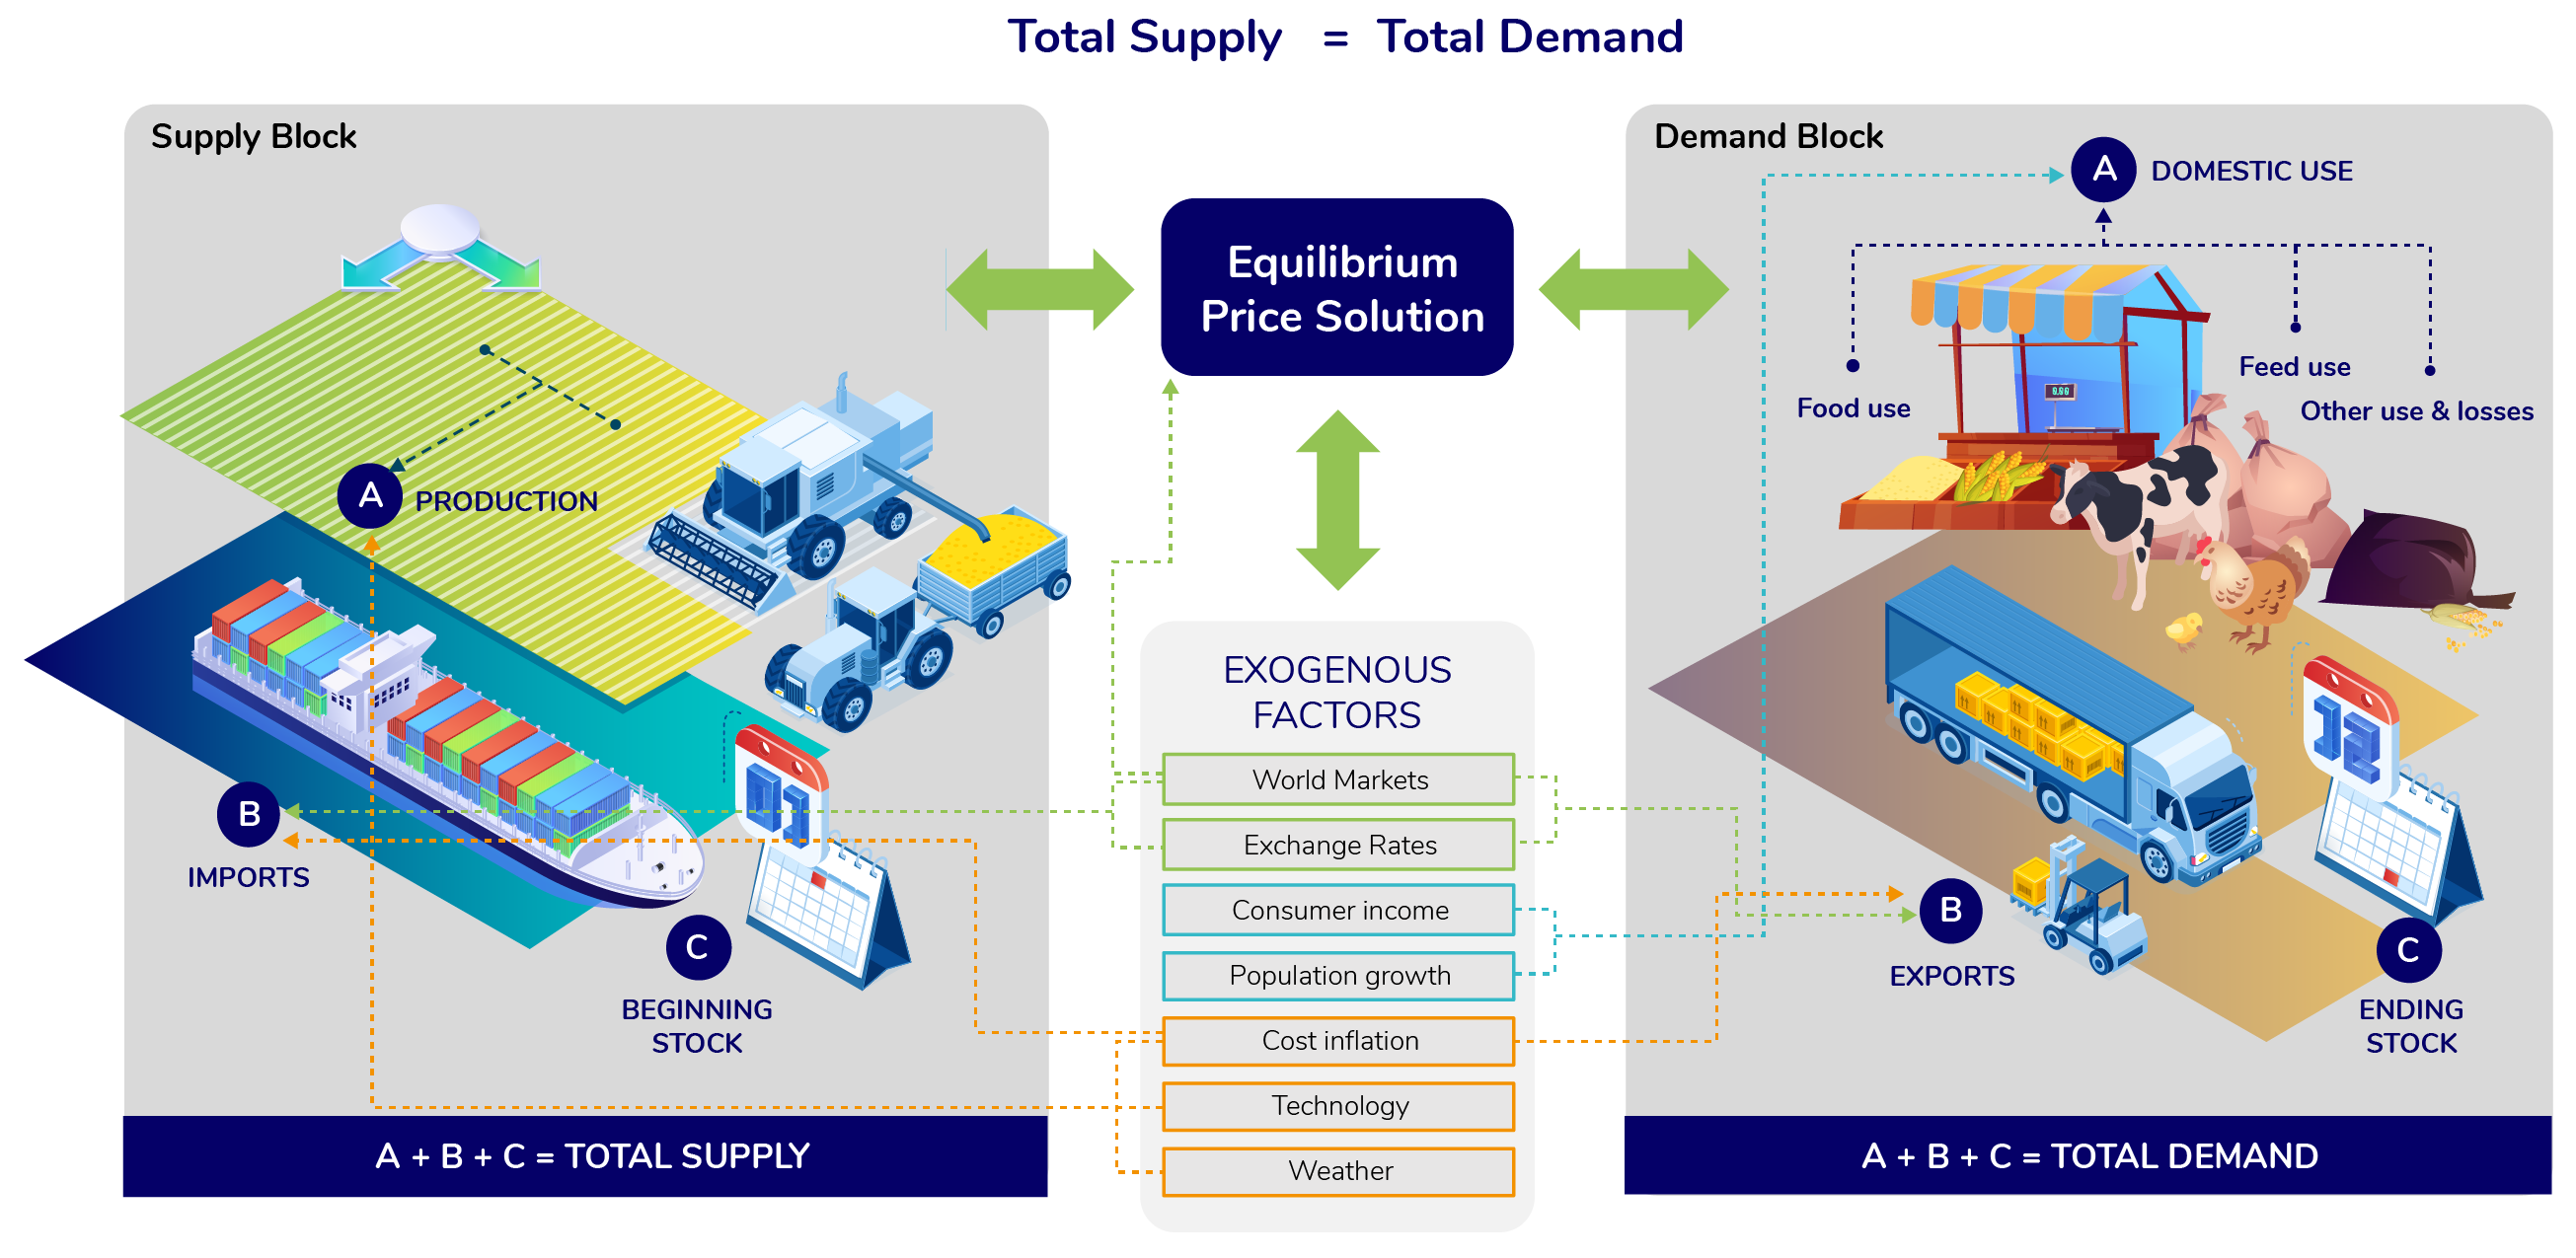
The multi-market Partial Equilibrium (PE) model typically used for this analysis has been developed by the Bureau for Food and Agricultural Policy over a number of years. Development was initiated by several specific research requests, which influenced initial country and commodity coverage, with the first comprehensive structure for grains and oilseeds in 8 countries established in 2012. The current version spans 12 countries and includes a wide range of commodities. Relevant sectors are linked through both competition for resources and input output relationships. For instance, livestock is linked to grains through animal feed and so scenarios that impact the livestock sector spill into grains and vice versa.
The multi market model is a dynamic, recursive partial equilibrium framework, based on balance sheet principles to establish equilibrium, where total supply (production, imports and stocks) must equal total demand (consumption, export and ending stock) for any given product. It comprises a system of equations designed to incorporate the major economic, biological and policy relationships in the market. The strengths of the partial equilibrium framework lie in this ability to capture intricate market and policy details, that closely mimic the actual market environment and price formation dynamics for specific commodities. This approach, together with the analyses of market prices, provides the backbone for detailed market analysis that forms that foundation for the market-led approach of this project. This also enables detailed scenario analysis when changes occur in any of the existing variables or relationships.
Model specification is generally based on well accepted structures and specifications of supply and demand, with prices based on a combination of import or export parity, and domestic supply and demand dynamics, depending on the market situation for each commodity. In commodities such as maize, where regional trade dynamics are important, the model also captures trade and pricing relationships within the region in an innovative bilateral trade specification which enables multiple markets to interact simultaneously. The modelling framework ensures consistency in supply and demand relationships and is able to provide price impacts of alternative scenarios, as well as a dynamic supply and demand response over time.
Parameterisation is based on a combination of econometric estimation and elasticity assumptions based on literature review, theoretical consistency and specialist judgement. The model is calibrated based on historic data, with the period dependent on data availability and consistency.
The dependence on historic data, both for estimation and calibration purposes, implies that significant emphasis must be placed on the quality of the historic data feeding into the model. Initial commodity balance sheets were compiled based on a range of secondary data sources. While the official national data provided the starting point for balance sheet compilation, complementary data from the other listed sources provided opportunities for validation and alternatives where required.
PPVC tool 4: IFPRI’s economy wide RIAPA model
The Rural Investment and Policy Analysis (RIAPA) data and modeling system is IFPRI’s primary tool for forward-looking, economywide country-level analysis. It serves as a simulation laboratory for experimenting with policies, investments, or economic shocks. At the core of RIAPA is IFPRI’s standard recursive-dynamic Computable General Equilibrium (CGE) model, which is calibrated to a Nexus Social Accounting Matrix (SAM) unique to the country of analysis. Several RIAPA add-on modules track specialized outcome indicators relevant to our understanding of inclusive agricultural transformation and economic development, including indicators on agrifood system growth, employment, poverty, and diet quality.
What makes RIAPA ideally suited to PPVC analysis?
RIAPA possesses several distinguishing features that make it well-suited to PPVC analysis.
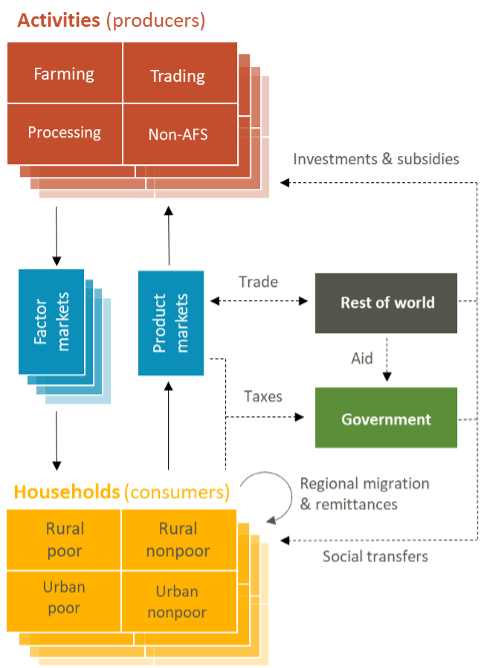
The core data underpinning the RIAPA country modeling system is a Social Accounting Matrix (SAM), which is an economywide database. IFPRI’s Nexus SAMs adopt common data standards and classification systems, ensuring greater data transparency and consistency across countries. A typical Nexus SAM includes up to 95 economic sectors, of which about half are either in primary agriculture, agri-food processing, or food services sectors. These sectors, together with the trade and transport sectors that link them, form what is referred to as the agrifood system (see figure). The detailed representation of the agrifood system in the SAM means RIAPA can assess the extent to which policies or investments affecting farmers or value chains have spillover implications for other actors in the input supply, trade, agroprocessing, or food service sectors.
At the core of RIAPA is IFPRI’s standard recursive-dynamic Computable General Equilibrium (CGE) model. This economywide model incorporates flexible behavioral features, such as nested production functions, imperfect substitution of imported commodities, and linear expenditure systems of consumer demand. Consumers and producers interact via competitive product and factor markets, ultimately maximizing utility and profits based on factor and product prices, which adjust endogenously to establish market equilibrium. Population growth and urbanization are set exogenously, affecting labor supplies, while sectoral capital accumulation is endogenously determined based on past investments. Because of competition for resources and structural differences across sectors, not all policies or investments are equally effective at achieving the same development outcomes. Policies and investments may also create winners and losers. Since the RIAPA models capture these trade-offs, model results can inform policymakers of the intended and unintended consequences of alternative policy choices and help them select a mix of policy options that most closely align with the development priorities of their government.
The richness of the SAM database means RIAPA produces detailed results on sectoral output and employment and market prices. RIAPA also captures detailed income and expenditure patterns of up to 20 representative household groups defined by per capita expenditure deciles and rural and urban areas. To further enhance our understanding of the implications of policies and investments for agricultural transformation and social inclusion, CGE results are complemented in two ways. First, unique outcome indicators relating to growth and employment within the agrifood system are calculated from the CGE results; and second, CGE model results are linked to survey-based microsimulation modules to assess impacts of shocks on poverty and diets of individual households and people.
The table below lists the social inclusion (i.e., poverty and employment) and agricultural transformation (i.e., growth and diets) outcome indicators. In short, the growth and employment growth multipliers are derived from measures of GDP and employment in the agrifood system (called AgGDP+ and AgEMP+). They respectively measure the changes in agrifood system GDP or employment for every unit increase in agricultural GDP generated by the targeted value chain. The poverty and diet indicators are estimated in the survey-based microsimulation models that link to the core CGE model. The poverty indicator is a poverty-growth elasticity that measures the percentage-point change in the poverty headcount rate per unit of agricultural GDP growth. The poverty headcount rate is the share of the population with consumption below the international $1.90 poverty line. Similarly, the diet deprivation growth elasticity measures the percentage change in the Reference Diet Deprivation (ReDD) index per unit of agricultural GDP growth.
| Social Inclusion | Agricultural transformation | |||
|---|---|---|---|---|
| Poverty | Employment | Growth | Diets | |
| Purpose | Measures the effectiveness of a value chain in reducing poverty | Measures the effectiveness of a value chain in creating jobs across the agri-food system | Measures the effectiveness of a value chain in generating growth in the agrifood system | Measures the effectiveness of a value chain in reducing diet deprivation |
| Interpretation | Reflects the extent to which the poor benefit from wage income or lower prices due to value chain development | Reflects employment intensities within value chains, both on and off the farm | Reflects the extent to which a value chain is transformative in that it generates growth within its off-farm component | Reflects changes in the incidence, breadth, and depth of diet deprivation across six food groups |
| Indicator | Percentage-point change in national poverty headcount rate per dollar increase in GDP of targeted value chain | Percent change in Agrifood system employment per dollar increase in GDP of targeted value chain | Percent change in Agrifood system GDP per dollar increase in GDP of targeted value chain | Percent change in diet deprivation index per dollar increase in GDP of targeted value chain |